2025 London Boroughs Healthy Streets Scorecard launched!

Rising star Newham leaps up the London Healthy Streets Scorecard 5 places and receives special 2025 Most Improved Borough award
On 8 July, a coalition of London transport campaigners launched the 2025 London Boroughs Healthy Streets Scorecard for the 7th year running, at an online launch event attended by over 100 people.
- To explore the full results, data and the maps visit the Healthy Streets Scorecard website
- Watch a recording of the launch event with the results presentation from coalition member Jeremy of London Living Streets, and speeches from Mayor of Newham Rokhsana Fiaz, Sam Margolis from Camden and Cllr Rowena Champion from Islington
- View the full results presentation – Healthy Streets Scorecard 2025 results presentation 8Jul25
- Check out Sam Margolis’ presentation on Camden’s Transprot Strategy Healthy Streets Scorecard 2025 results presentation 8Jul25 Sam Margolis – Camden Transport Strategy – Healthy Streets Scorecard July25 presentation
The Scorecard scores each London borough based on action taken to promote healthier streets by enabling more trips by walking, cycling and public transport, more active travel and less road danger. This year saw lots of action on the introduction of 98 new traffic-free school streets across London. Five boroughs increased coverage of 20mph speed limits and six increased streets with controlled parking. There was also more limited progress on LTNs, bus lanes and protected cycle track.
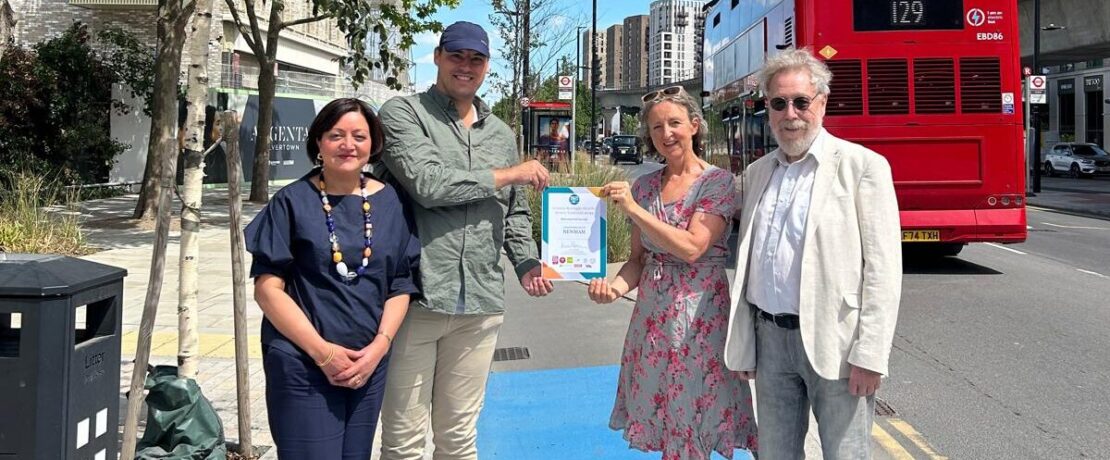
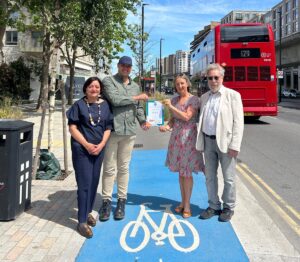
This year the coalition made a special award to the Most Improved Borough Newham which leapt 5 places, from overall 13th to 8th place on the Scorecard. Congratulations to Newham! The council increased the proportion of schools with a traffic-free ‘school street’ from 21% to 44% of all schools in the borough (this is a street outside the school which is pedestrianised at times when pupils arrive and leave). They also increased the proportion of streets covered by a 20mph speed limit from 41% to 99%.
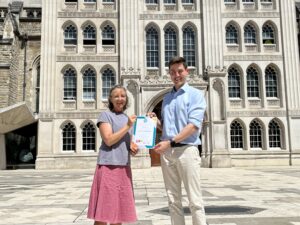
Accolades also go to Overall Winner City of London, best inner London borough Islington and best outer borough Waltham Forest. All these councils have consistently stayed at the top of the Scorecard by continuing to take action each year and with outstanding scores on many indicators.
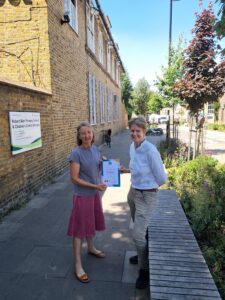
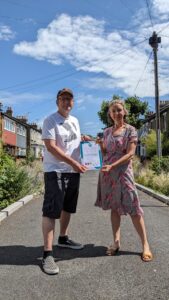
CPRE London manages the coalition and the project and Alice Roberts from CPRE London delivered certificates to the winning boroughs. Here are councillors from each borough receiving their awards – and below that you can read what they said!
Ealing also made improvements, rising from 18th place to 15th, and is now the second best Outer London borough. The council increased the proportion of schools with a school street (from 25% to 36%) and the proportion of roads with a 20mph speed limit (from 88% to 100%). Lambeth jumped two places from 8th to 6th place, with a big increase in the proportion of schools with a school street, rising from 35% to 48%, and small improvements on many other indicators.
At the other end of the scale, Tower Hamlets dropped a disappointing 4 places – the most of any borough in terms of a drop in rank order, and largely due to inaction compared to others. Lewisham also dropped 3 places, with small decreases across many indicators, and despite a promising and welcome increase in controlled parking coverage from 21% to 26% of roads, and despite a top score on traffic-free ‘school streets’. Lewisham and Kensington and Chelsea remain at the bottom of the Inner London boroughs, and Bexley and Hillingdon remain bottom of the outer London boroughs – reflecting inaction relative to other boroughs or just failure to take action at all. In Bexley’s case, they remain bottom of the table with little or no action on most indicators, though there was a welcome increase in controlled parking from 16% to 23% of streets.
A coalition spokesperson said: “Congratulations and thanks to our winners, but we really need all councils pulling their weight, urgently. The boroughs now have dedicated ‘Local Implementation Funding’ and need to move fast to deliver if any of the Mayor’s ‘healthy streets’ targets for London are to be met. Now is the time for boroughs at bottom of table to start acting more like Newham and the scorecard leaders, to show their declarations of action on road danger, climate, health and air pollution are in any way meaningful. We really hope to see much stronger action from all boroughs in the coming year.”
| Metric | Best borough/s | Worst borough/s |
| % of streets with Low Traffic Neighbourhood | 69% (Hackney*) | 6% (Bexley) |
| % of schools with traffic-free School Streets | 56% (Lewisham) | 0% (Bexley, Hammersmith & Fulham) |
| Controlled Parking Zone coverage final scores as % | 98% (Hackney) | 10% (Bromley) |
| 20mph speed limits as % of borough managed roads | 100% (Camden, Ealing, Lewisham, Islington, City of London, Southwark, Hammersmith & Fulham, Tower Hamlets, Hackney, Kensington & Chelsea, Westminster) | 5% (Bromley) |
| Protected Cycle Track. % of borough roads where cycling is physically protected | Waltham Forest (12%)* | Kensington and Chelsea (0%) |
| % of bus routes with bus priority (through bus lanes or modal filters) | 51% (Hackney*) | 1% (Bexley) |
| Cars registered per 100 households | 29 (Islington*) | 106 (Hillingdon) |
| % households with no car | 75% (Westminster**) | 22% (Havering) |
| % of polluting diesel cars | 13% (Sutton) | 21% (Barking & Dagenham) |
*We do not include the City of London in highest and lowest scores because its scores are not always comparable (this is because it is not primarily a residential borough and relates to the methodology we use). That said, we do reflect the action the City has taken in our commentary, and we do include it in the average scores and in our charts, to give a complete picture.
** Data for Westminster and City of London are combined in this data supplied to us by TfL.
QUOTES FROM WINNING BOROUGHS
Rokhsana Fiaz, Mayor of Newham, said: “I’m incredibly proud that Newham has been named the Most Improved London Borough in the 2025 Healthy Streets Scorecard. This is a testament to the success of our Healthy School Streets programme – putting the health and safety of our children and communities first by cutting traffic, reducing pollution, and transforming how we safely move through our neighbourhoods. With traffic volumes down by an average of 64%, and up to 80% in some locations, we are seeing the real impact of our commitment to cleaner, greener, safer streets. This progress is at the heart of Opportunity Newham – our mission to build a fairer, healthier, and more sustainable borough for everyone. I want to thank all our schools, families, officers and residents who’ve helped make this happen.”
Tom Sleigh, Chairman of the City of London Corporation’s Planning and Transportation Committee, said: “My thanks to the CPRE and our brilliant Officers for this award which recognises the progress of the City Corporation’s Transportation Strategy, making the Square Mile a safer and more pleasant environment for everyone to travel through. The recently completed improvement works at Bank Junction, in particular, have been a great success with many more people now relaxing and enjoying themselves in this more pedestrian friendly and vibrant area.”
Rowena Champion, Islington’s Executive Member for Environment, Air Quality & Transport, said: “We’re thrilled that Islington has once again been recognised as the healthiest inner London borough — five years running! This isn’t just about transport; it’s about creating streets that people enjoy, where children can walk to school safely, and where cleaner air and greener spaces help our communities thrive.
“From reducing traffic pollution and calming roads, to planting more trees and delivering new walking and cycling routes, we’re making it easier than ever to walk, wheel, and breathe easy in Islington. Our school street improvements, like the recent changes at Christ the King in Tollington, are helping to make school runs safer and healthier for families.
“We’re proud of what we’ve achieved, but we know there’s more to do. Through our borough-wide Liveable Neighbourhoods programme — shaped by local people, for local people — we’re continuing to transform our streets into places that benefit everyone.”
Cllr Clyde Loakes, Deputy Leader of Waltham Forest Council and Cabinet Member for Climate and Air Quality, said: “It’s been another great year for active travel in Waltham Forest, and I’m delighted that we have won the London Healthy Streets’ best outer borough award for the fifth year running.
“Local residents are already benefitting from a new low traffic neighbourhood around Lloyd Park as well as new separate cycle track in Hoe St and rain gardens, parklets, and modal filters across the borough. These improvements not only help encourage walking and cycling, but at the same time help to mitigate against extreme weather and make our local neighbourhoods greener and more climate resilient.
“Over the next year, we will be progressing our extensive improvement work along Forest Road that goes through the heart of the borough, as well as creating dedicated walking and cycling routes on the busy Whipps Cross Road and rolling out hundreds more cycle hangars, all helping to support even more people to walk and cycle more of their local daily journeys.
“Waltham Forest will continue to champion and roll out active travel infrastructure and initiatives, because we know the benefits for the health and well-being of our residents and families and improvements in air quality and climate resilience are very real.”
NOTES TO EDITORS
- www.healthystreetsscorecard.london 2025 results will be published 00:01 Monday 7 July 2025. Data spreadsheet here. Charts and summary data will be published on the day. Charts available on request.
- Each year, the London Boroughs Healthy Streets Scorecard sets out data to show the health of each borough’s streets according to ten indicators. The aim is to enable councils and residents to compare how well their borough is doing in relation to others and identify areas for action. Ultimately the intention is to promote action on key infrastructure which will increase the proportion of trips made by public transport, walking and cycling; increase active travel rates (walking, wheeling, cycling) for healthier lifestyles; eliminate road casualties; and achieve clean air and net zero carbon emissions. The 2025 London Boroughs Healthy Streets Scorecard is published at www.healthystreetsscorecard.london.
- The Scorecard is created by a coalition of environmental, transport and road safety NGOs, to promote action on key inputs (Action Vision Zero, CPRE London, Future Transport London, London Cycling Campaign, London Living Streets, Possible, Sustrans in London, and Wheels for Wellbeing). Contacts on request.
- The Scorecard tracks progress on delivery of key ‘inputs’ and resulting ‘outcomes’. It ranks London Boroughs on how healthy their streets are according to ten indicators (four ‘outcome’ and six ‘input’ indicators). By combining the indicator scores, each borough is given a final Healthy Streets score. Analysis and commentary is provided each year on indicators and individual boroughs.
- The London Low Traffic Neighbourhoods by borough map has been created by the Healthy Streets Scorecard coalition. The Scorecard used the LTN map data to calculate the proportion of Low Traffic Neighbourhoods in each borough relative to the area which is potentially suitable to be LTNs. TfL’s Strategic Neighbourhood Analysis was used to identify the total area in each borough appropriate for LTNs.
- This year we carried out a thorough audit of the data we held on protected cycle tracks and removed a number of inherited records that did not meet our criteria for inclusion, including TfL-designated routes that didn’t offer physical protection. As part of our work to improve the accuracy of the data we have created a new map of London’s protected cycle tracks. To view the map, and for more details on our criteria for inclusion, follow this link: https://maphub.net/lcc/hss-cycle-tracks.
- The London Bus Priority map has been created by the Healthy Streets Scorecard coalition by mapping London bus routes (using Bus lane data from January 2021 (TfL)). Each route within a borough was assessed to calculate the length with priority (through bus lanes or modal filters (LTN data from London Low Traffic Neighbourhoods by borough map). Length of route with priority were added together to obtain the proportion of priority relative to total length of bus routes to give an overall borough score.
- The London Controlled Parking Zones by borough map has been created by Will Petty in conjunction with the Healthy Streets Scorecard coalition by mapping area of Controlled Parking Zones (CPZs). The CPZ map data is used to calculate the CPZ score, as a proportion of total area appropriate for CPZs. Boroughs where ‘roaming’ is allowed i.e. where a parking permit allows the holder to park throughout the borough, are marked down this does not discourage short car trips TfL’s Strategic Neighbourhood Analysis was used to identify the total area in each borough appropriate for CPZs.