Fall in car ownership in London releases 64 football pitches worth of space

CPRE London today launches the 2022 London Boroughs Healthy Streets Scorecard alongside coalition partners.
[Also read What connects Rural England and healthy streets in London]
Alice Roberts, our Head of Campaigns, who manages the Healthy Streets Scorecard project and coordinates the coalition, said:
“We are delighted to see the big fall in car registrations in London. In December 2021 there were 39,000 fewer cars in London than in December 2020. This is incredibly important to us because cars are very inefficient of space. The 2.6 million cars in London take up 30 million square meters, equivalent to 4,200 full sized football pitches. This year’s fall in car ownership has freed up a space the size of 64 football pitches.
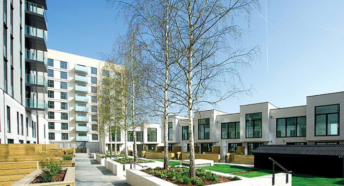
Space is really important to us because a key aim for CPRE London and the CPRE family is to stop urban sprawl and the only way to do this is use space better and create ‘compact, efficient cities’.
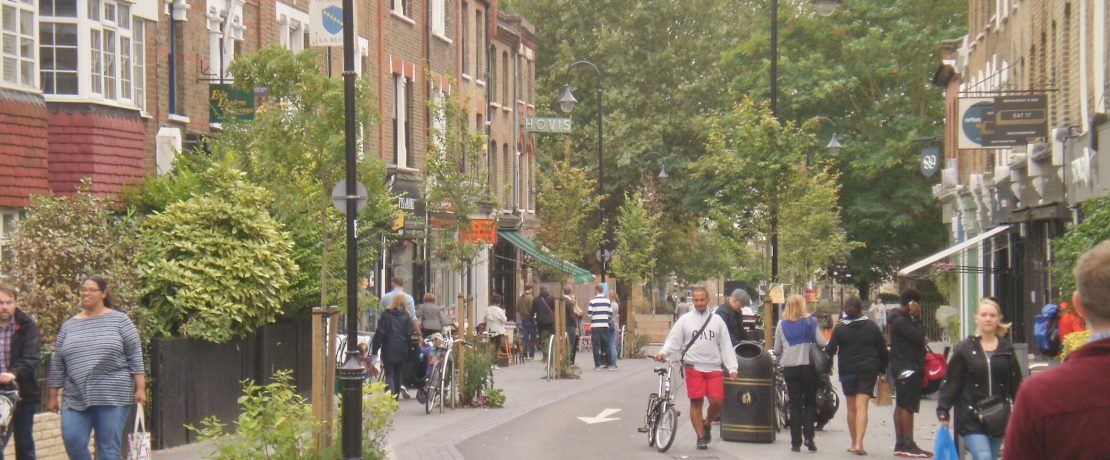
Urban sprawl is low-density development, outside city boundaries, unable to support local buses, jobs, shops and services. It relies on cars. It’s high carbon: it correlates with increased energy use, pollution & traffic congestion. It increases transport costs & social isolation. And it results in loss of countryside; destruction of agricultural land & wildlife habitat.
Compact, efficient cities, on the other hand, enable people to live close to jobs and amenities and travel more sustainably. They protect parks and green spaces for health, recreation, sport and nature. We create compact cities by using land efficiently, recycling and regenerating wasted space. They are built around public transport, walking and cycling, not cars, which are very inefficient of space, not just for parking, but roads too, where they compete for space with buses.
The London Mayor’s Transport Strategy contains a target to increase use of public transport, walking and cycling from 60% of trips to 80% by 2041. It is this target that the Healthy Streets Scorecard coalition is centrally concerned with, recognising London boroughs have a key role to play.
CPRE London is part of the coalition because delivering the target will help save our countryside. We also see it will make London happier and healthier, reducing pollution, congestion, noise, carbon emissions and road casualties, and boosting active lifestyles.
Promoting sustainable transport is vital for saving our countryside. But it will also have an enormous impact on the health of those who live or work in London. And deliver a much greener city.”
The 2022 Healthy Streets Scorecard
- New Scorecard ranks how well boroughs are doing at creating healthier streets
- Concerns of worsening health inequities as gap widens between ‘best’ and ‘worst’ areas
- Rapid rollout of ‘School Streets’ and substantial reduction in car ownership seen in parts of London
- New data is published on the proportion of bus routes in each borough which have a bus lane or other ‘ bus priority measure’
New data reveals a gulf between the boroughs shown to be the best and worst at delivering healthier and more sustainable mobility in London with the top scorers continuing to demonstrate that it’s possible to deliver Healthy Streets and transport decarbonisation amid a funding crisis, and in an election year.
Highest scoring London boroughs were the City, Islington, Hackney and Camden in Inner London. Waltham Forest again outperforms some Inner boroughs to become the top Outer borough and Richmond overtakes Merton to take second place there. Southwark is the top South London borough.
Lowest scoring boroughs Hillingdon, then Barking & Dagenham and Redbridge are the boroughs with the unhealthiest streets in London, so far reluctant to deliver bold schemes to tackle the health and climate crises.
The London Boroughs Healthy Streets Scorecard sets out data showing the health of each borough’s streets according to a series of indicators. This year’s updated scores showed wide gaps on all indicators. Londoners can see how their borough scored in 2022 at healthystreetsscorecard.london.